From 1 December to 3 December 2021, I ran a survey on the members of the r/antiwork community including its Discord server. This blog post contains the full results.
Table of Contents
- Methodology
- Where Do You Live?
- Is English your Primary Language?
- How Old Are You?
- What Is Your Gender Identity?
- What Is Your Employment Situation?
- When Did You Discover r/Antiwork?
- Do You Have a Specific Political Leaning?
- On a Scale of 1–10, How do you Rate the Moderators?
- How do you Engage with the Antiwork Community?
- Comments and Suggestions
Methodology
A survey was published on this site asking a handful of question that should have only taken a few minutes to answer, encouraging maximum possible contribution.
A period of exactly 48 hours was chosen (from midday UTC) because time lengths which are not a multiple of 24 hours can result in time zones influencing the survey results.
Overall, we had 13,582 responses.
By avoiding third-party survey hosts, I was able to combine technical measures with statistical analysis to detect attempts to brigade the survey, where outside groups attempt to submit hundreds of responses to influence the results. Luckily, the only attempt to brigade seems to be from r/drama, who are not very good at it.
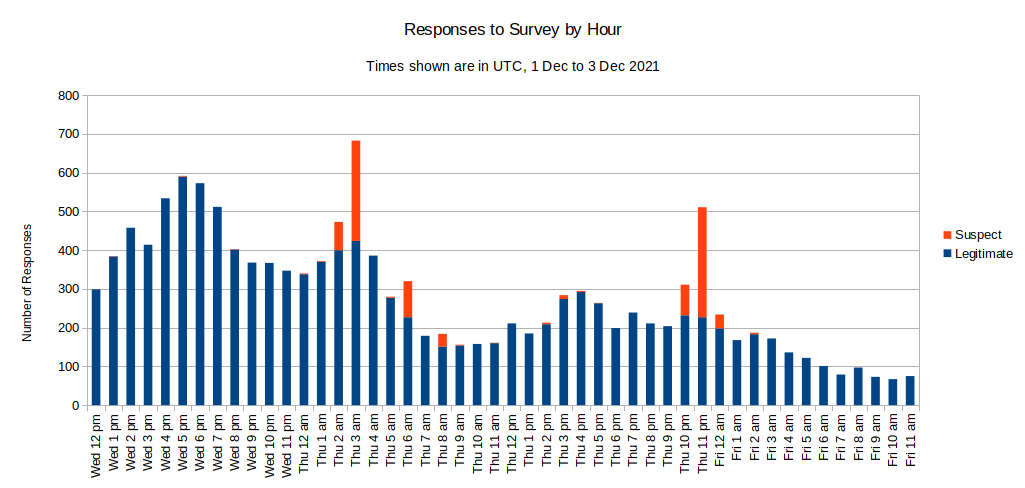
The attempt at brigading was filtered out and 12,689 responses remained. The statistics in this post are based on only the legitimate responses.
Where Do You Live?
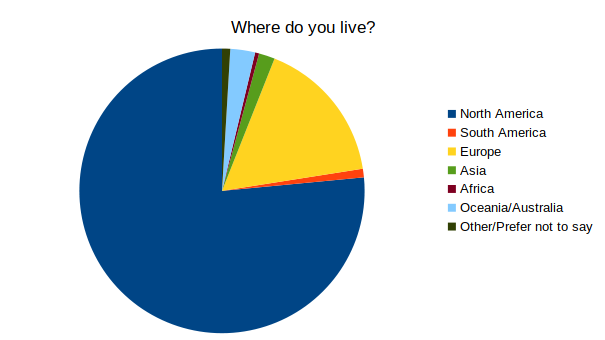
Reddit is a largely American website, with roughly half of Reddit users from the USA. This is even more true of r/antiwork, with 76.52% of members from North America (although this also includes Canada and Mexico).
Europe is also well-represented, with 16.5% of members. Members from other parts of the world are less common.
| Region | People | Percentage |
|---|---|---|
| North America | 9709 | 76.52% |
| South America | 124 | 0.98% |
| Europe | 2094 | 16.50% |
| Asia | 230 | 1.81% |
| Africa | 58 | 0.46% |
| Oceania/Australia | 356 | 2.81% |
| Other/Prefer not to say | 118 | 0.93% |
Is English your Primary Language?
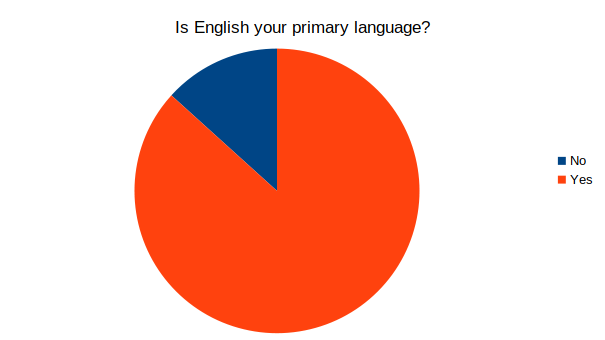
Mostly, yes. 86.71% of responses indicated English as their primary language. Some comments mentioned that the toggle button used in the survey was unclear as to whether it was selected or not, so that may affect the numbers slightly.
| Native English | People | Percentage |
|---|---|---|
| Yes | 11003 | 86.71% |
| No | 1686 | 13.29% |
How Old Are You?
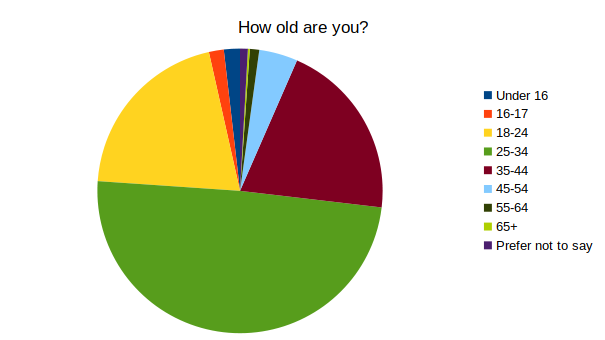
There is a widespread perception that r/antiwork is primarily a group of unemployed teenagers, but the results of the age survey prove at least half of that perception to be false. The biggest age group is 25–34, but 18–24 and 35–44 are each well-represented too. The 45+ crowd outnumbers under-18s.
| Age Range | People | Percentage |
|---|---|---|
| Under 16 | 231 | 1.82% |
| 16-17 | 214 | 1.69% |
| 18-24 | 2589 | 20.40% |
| 25-34 | 6247 | 49.23% |
| 35-44 | 2578 | 20.32% |
| 45-54 | 556 | 4.38% |
| 55-64 | 135 | 1.06% |
| 65+ | 27 | 0.21% |
| Prefer not to say | 112 | 0.88% |
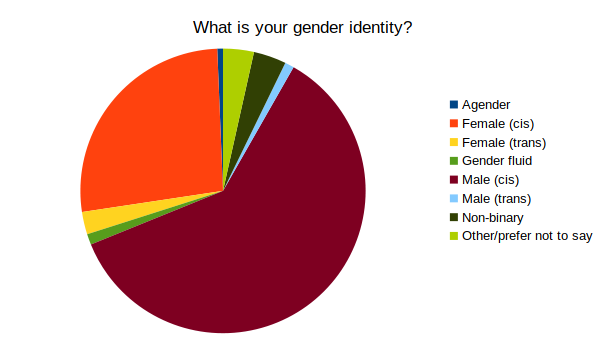
What Is Your Gender Identity?
At r/antiwork, we try to be an inclusive community and this question was to help us figure out how well we’re doing at that.
| Gender Identity | People | Percentage |
|---|---|---|
| Female (cis) | 3392 | 26.73% |
| Female (trans) | 324 | 2.55% |
| Male (cis) | 7691 | 60.61% |
| Male (trans) | 132 | 1.04% |
| Gender fluid | 155 | 1.22% |
| Agender | 82 | 0.65% |
| Non-binary | 470 | 3.70% |
| Other/prefer not to say | 443 | 3.49% |
In some of the later questions, I separate results into just three female/male/other categories instead of eight. I include both cis and trans female in the female category, cis and trans male in the male category, and everybody else (including “prefer not to say”) as the other category.
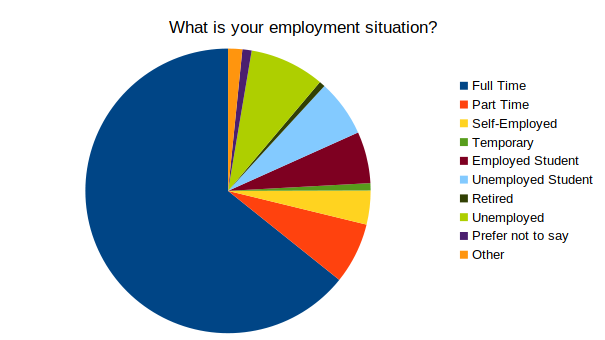
What Is Your Employment Situation?
Again, shattering the perception that r/antiwork consists mostly of unemployed teenagers, nearly two-thirds of respondents have full time jobs. After all, why complain about having to work if you don’t have to work? Many others are in other forms of employment or education. Those not in employment or education, make up less than 10% of the community, even if you include retirees!
| Employment Situation | People | Percentage |
|---|---|---|
| Full Time | 8152 | 64.24% |
| Part Time | 881 | 6.94% |
| Unemployed | 1077 | 8.49% |
| Employed Student | 744 | 5.86% |
| Unemployed Student | 819 | 6.45% |
| Self-Employed | 489 | 3.85% |
| Temporary | 105 | 0.83% |
| Retired | 85 | 0.67% |
| Other | 204 | 1.61% |
| Prefer not to say | 133 | 1.05% |
Comments suggested future surveys might include “Unemployed by choice” and “Overemployed” (i.e. working multiple jobs which add to more than a 40-hour work week).
Breaking Down the Employment Situation
By Gender
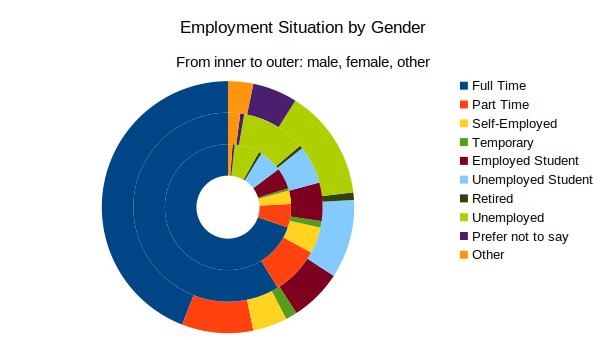
Male respondents are more likely to work full-time.
Genderfluid, non-binary, agender, etc respondents are more likely to be unemployed, perhaps reflecting workplace discrimination.
By Age
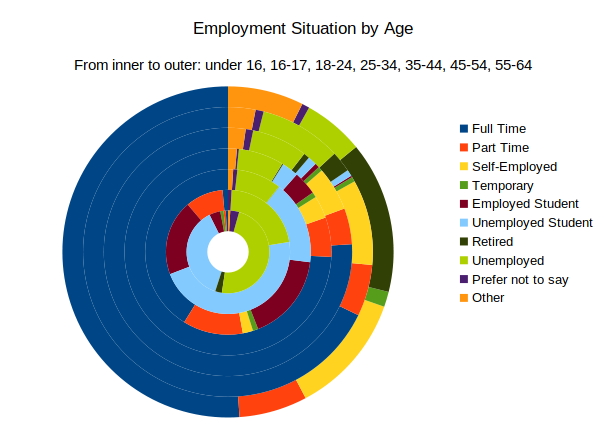
Unsurprisingly, younger respondents are more likely to be students, and older respondents are more likely to be retired. Self-employment is rare before the age of 35.
Respondents aged 65 or over are excluded from this graph as there were not enough responses for a meaningful comparison.
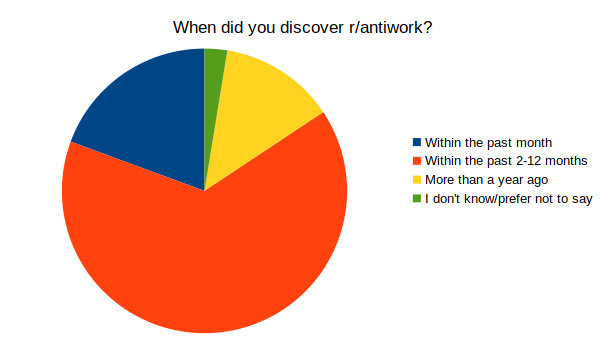
When Did You Discover r/Antiwork?
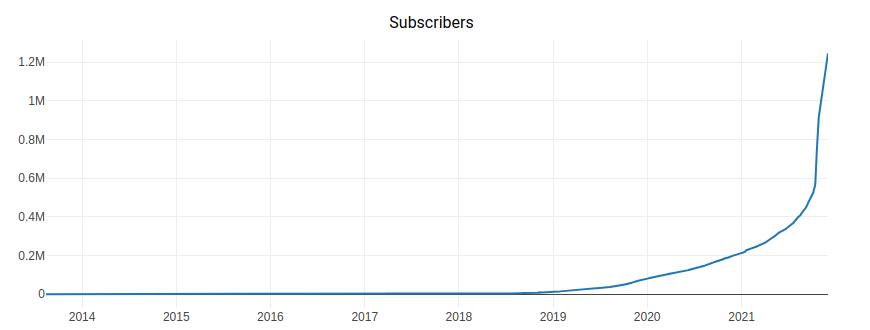
r/Antiwork has grown tremendously in the last few months and has doubled in size from mid-October to over 1.2 million members. Although it still hasn’t entered the top 400 subreddits on Reddit by member count, it is in the top ten most active by number of posts and comments. It should be of no surprise that most people surveyed are fairly new to the community.
| Time Period | People | Percentage |
|---|---|---|
| Within the past month | 2458 | 19.37% |
| Within the past 2-12 months | 8244 | 64.97% |
| More than a year ago | 1662 | 13.10% |
| I don’t know/prefer not to say | 325 | 2.56% |
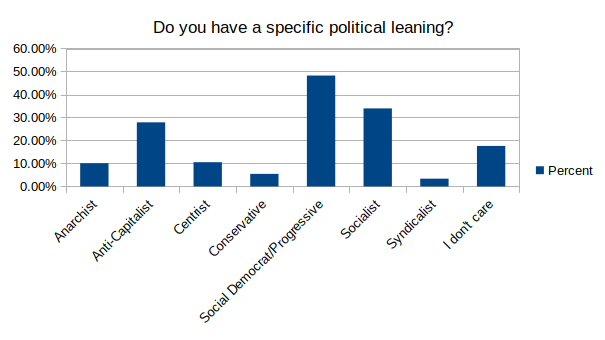
Do You Have a Specific Political Leaning?
Antiwork is inherently aligned with socialist, anarchist, and general leftist politics, so it is not surprising to find high percentages of people identifying with those labels.
Respondents were able to make more than one choice, so percentages add up to more than 100%.
| Political Leaning | People | Percentage |
|---|---|---|
| Anarchist | 1283 | 10.11% |
| Anti-Capitalist | 3540 | 27.90% |
| Centrist | 1340 | 10.56% |
| Conservative | 692 | 5.45% |
| Social Democrat/Progressive | 6121 | 48.24% |
| Socialist | 4307 | 33.94% |
| Syndicalist | 428 | 3.37% |
| I don’t care | 2238 | 17.64% |
Comments suggested future surveys might include “Libertarian”, “Liberal”, and “Communist”.
Breaking Down the Politics
By Location
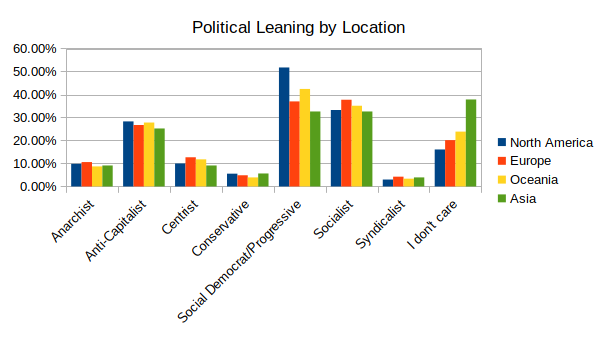
Europeans seem more comfortable identifying with the labels “Anarchist” and “Socialist” than North Americans.
The high number of “I don’t care” responses among Asians suggests that maybe other labels might better capture how Asians feel about politics.
Africa and South America are excluded from this graph as there were not enough responses for a meaningful comparison.
By Age
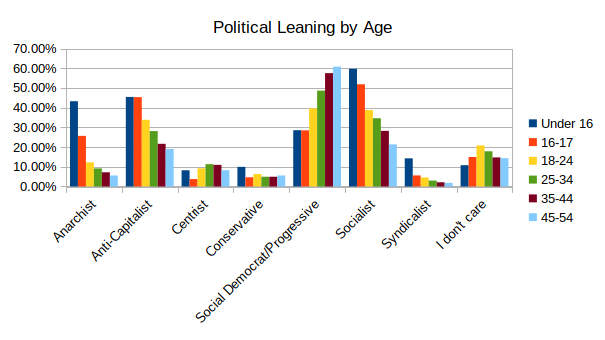
More radical labels like “Anarchist”, “Anti-capitalist”, and “Socialist” are adopted by younger age groups, while older respondents gravitate towards “Social Democrat” or “Progressive”.
Ages 55 and above are excluded from this graph as there were not enough responses for a meaningful comparison.
By Gender
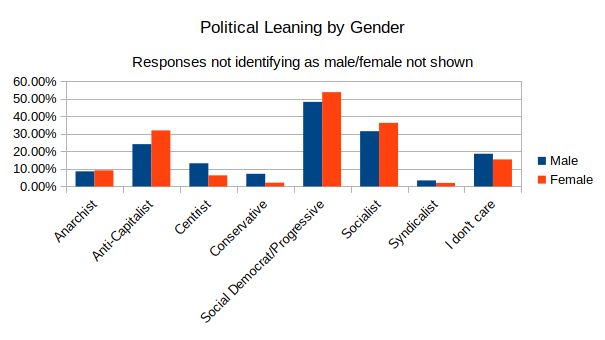
The men of the group seem more likely to adopt centrist and conservative labels.
Gender identities other than female and male are excluded from this graph as there were not enough responses for a meaningful comparison.
By Time in r/Antiwork
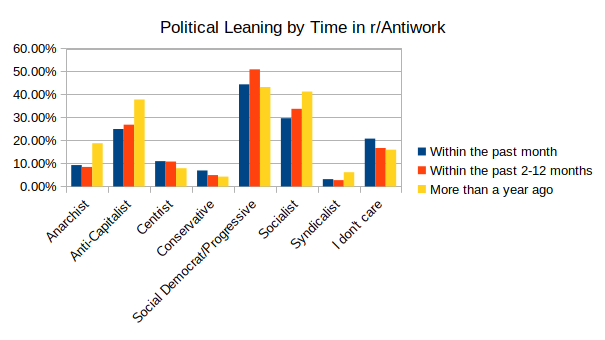
People who have been in the group for more than a year are more likely to use the labels “Anarchist”, “Anti-capitalist”, and “Socialist”. This may be because the growth of the group has brought in a lot of less radical members; it may be because the longer people are in the group, the more radical they become; it may be because less radical members leave rather than sticking around for more than a year. It is likely a combination of those factors.
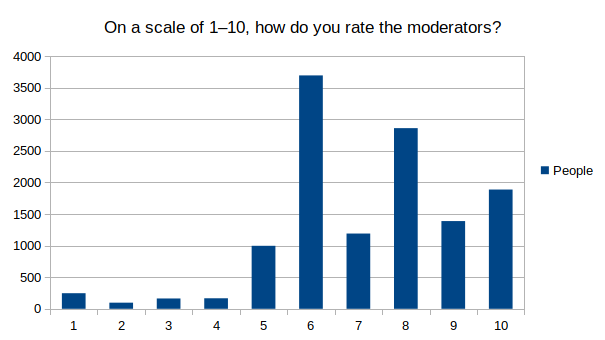
On a Scale of 1–10, How do you Rate the Moderators?
Overall, scores were pretty good. A lot more 8, 9, and 10 than 1, 2, and 3.
| Score | People | Percentage |
|---|---|---|
| 1 | 247 | 1.95% |
| 2 | 97 | 0.76% |
| 3 | 164 | 1.29% |
| 4 | 166 | 1.31% |
| 5 | 997 | 7.86% |
| 6 | 3693 | 29.10% |
| 7 | 1191 | 9.39% |
| 8 | 2859 | 22.53% |
| 9 | 1388 | 10.94% |
| 10 | 1887 | 14.87% |
The number slider needed to have a default, so I set that as 6. Half way between 1 and 10 is 5.5, but fractions weren’t possible, and it’s traditional to round .5 up, so 6 it was. That explains the peak at 6.
The overall average rating was 7.20, but female respondents rate the moderators at 7.47 while male respondents average at 7.14.
People who have been in the subreddit for longer rate moderators lower (7.01) than newcomers (7.26), but that could be because newcomers are politically more social democrat and progressive, and that happens to be the political leaning that rates the moderators most highly.
| Political Leaning | Rating |
|---|---|
| Anarchist | 7.01 |
| Anti-capitalist | 7.36 |
| Centrist | 6.80 |
| Conservative | 6.13 |
| Social Democrat/Progressive | 7.38 |
| Socialist | 7.31 |
| Syndicalist | 7.04 |
| I don’t care | 7.03 |
Anarchists object to authority. What a surprise. 🙂
But if the conservatives don’t like us, we’re probably doing something right.
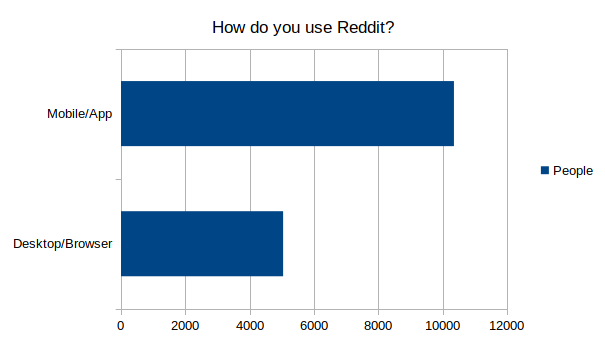
How do you Engage with the Antiwork Community?
The percentages here won’t add up to 100% because respondents could select multiple answers. There was nothing especially surprising in the first part of the question, but I was personally surprised how many people used Reddit on a phone/app compared to the desktop/browser version.
As an aside, it seems a lot of people taking the survey didn’t even know we had a Discord server, and immediately joined after taking the survey. In the 48 hours the server was running, membership of the server grew from about 1515 people to about 1960 people!
| Medium | People | Percentage |
|---|---|---|
| r/antiwork Subreddit | 11893 | 93.73% |
| Antiwork Discord | 242 | 1.91% |
| Antiwork Telegram | 83 | 0.65% |
| In real life | 841 | 6.63% |
| Reddit Platform | People | Percentage |
|---|---|---|
| Desktop/Browser | 5042 | 39.74% |
| Mobile/App | 10354 | 81.60% |
Comments and Suggestions
We did get a bunch of comments and suggestions with the surveys. As they’re free text, they’re not really suited to statistical analysis like this. But they’re not going to be ignored. With over 10,000 responses, it will take a while to go through them, but we will be reading them!